
Determining the right workforce size is a challenge many in the hospitality industry regularly face. Having a workforce too large comes with unnecessary overspending and potentially unhappy employees who are looking for more opportunities. Yet, a workforce too small makes it challenging to fill every shift adequately or can lead to an overworked, overstretched team that burns out quickly and underperforms.
Solving this challenge depends on many factors such as geography, pay rate, type of work, and use of temporary labor. At Nowsta, we leverage years of hospitality event data to analyze this problem and recommend optimal solutions to our customers. Here, we will break down an abridged version of our approach to this challenge with unique data insights and trends in the North American hospitality labor market.
Key Challenges to Optimizing Workforce Size
We first need to understand why this challenge exists for many businesses. Two common themes we both hear from our customers and see in our data are employee turnover and inability to predict attendance. To illustrate these themes let’s consider a catering company in New York City.
This company, during peak summer season, caters over 50 events per week across the city. Events range from 2-10 workers needed, translating to as many as 350 shifts per week, and on weekends may schedule up to 200 workers on a single day. Scheduling managers must prepare for worker unavailability, last-minute callouts, and future churn to ensure coverage weeks and even months in advance. They must also consider that lower volume of weekday events requires fewer workers, which leaves many of their weekend workers without weekday opportunities. Scheduling decisions with such factors in play can be difficult, but made easier with data. Let’s dive into our first theme below by analyzing worker retention.
Leveraging The Right Data
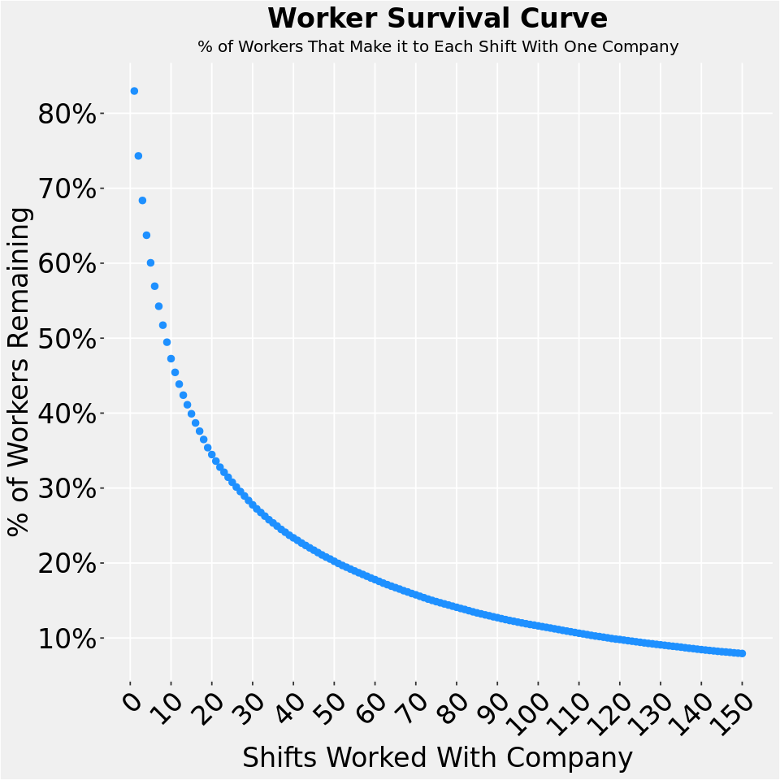
While solving business challenges requires customized data analysis, our graphs here represent overall trends among the 2.7 million events booked through Nowsta. The survival curve below shows the percentage of workers who worked at least 1 shift with a company who go on to work any number of shifts with that same company.
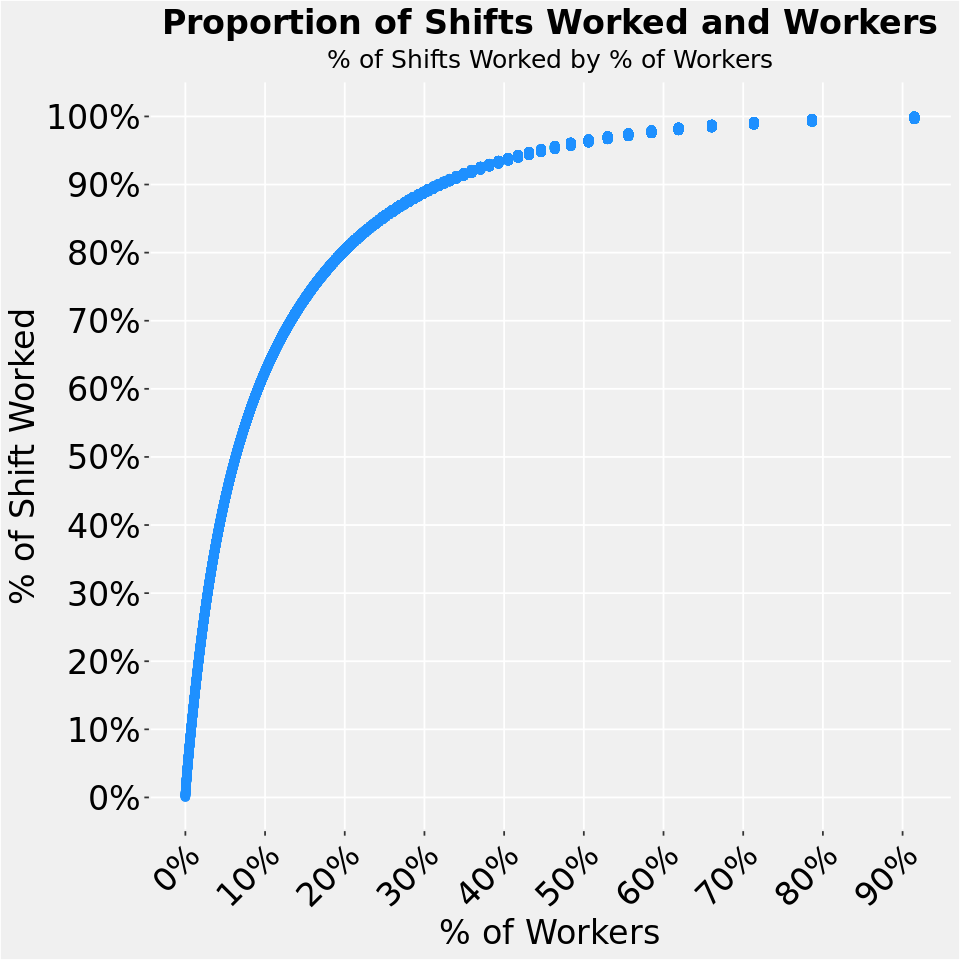
A natural follow-up question is how can businesses manage to fill their shifts despite not retaining so many workers. The graph below explains the answer, revealing the 80/20 rule. Businesses fill most shifts with their core employees, but at what point does a worker become a ‘core employee’?
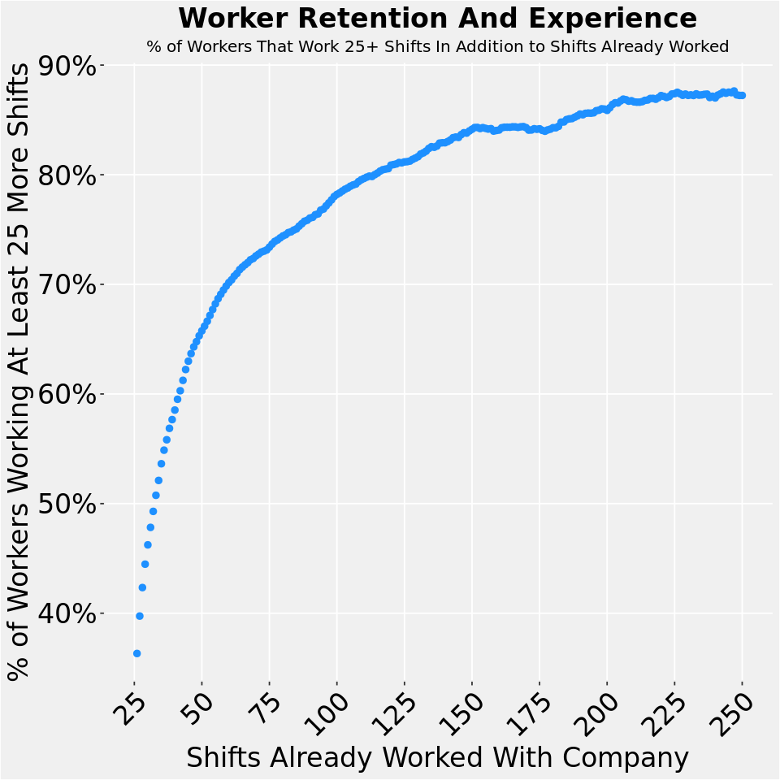
This next graph attempts to answer the core employee question by charting the percent of workers that become ‘core’ to a company given that they have already worked any number of shifts with the company. For the purposes of the analysis, a core employee is defined as one who works at least 25 additional shifts from a given perspective shift. The minimum number of shifts may vary for each business. These results attest to the difficulty businesses have retaining experienced employees.
Factors that Drive Worker Attendance
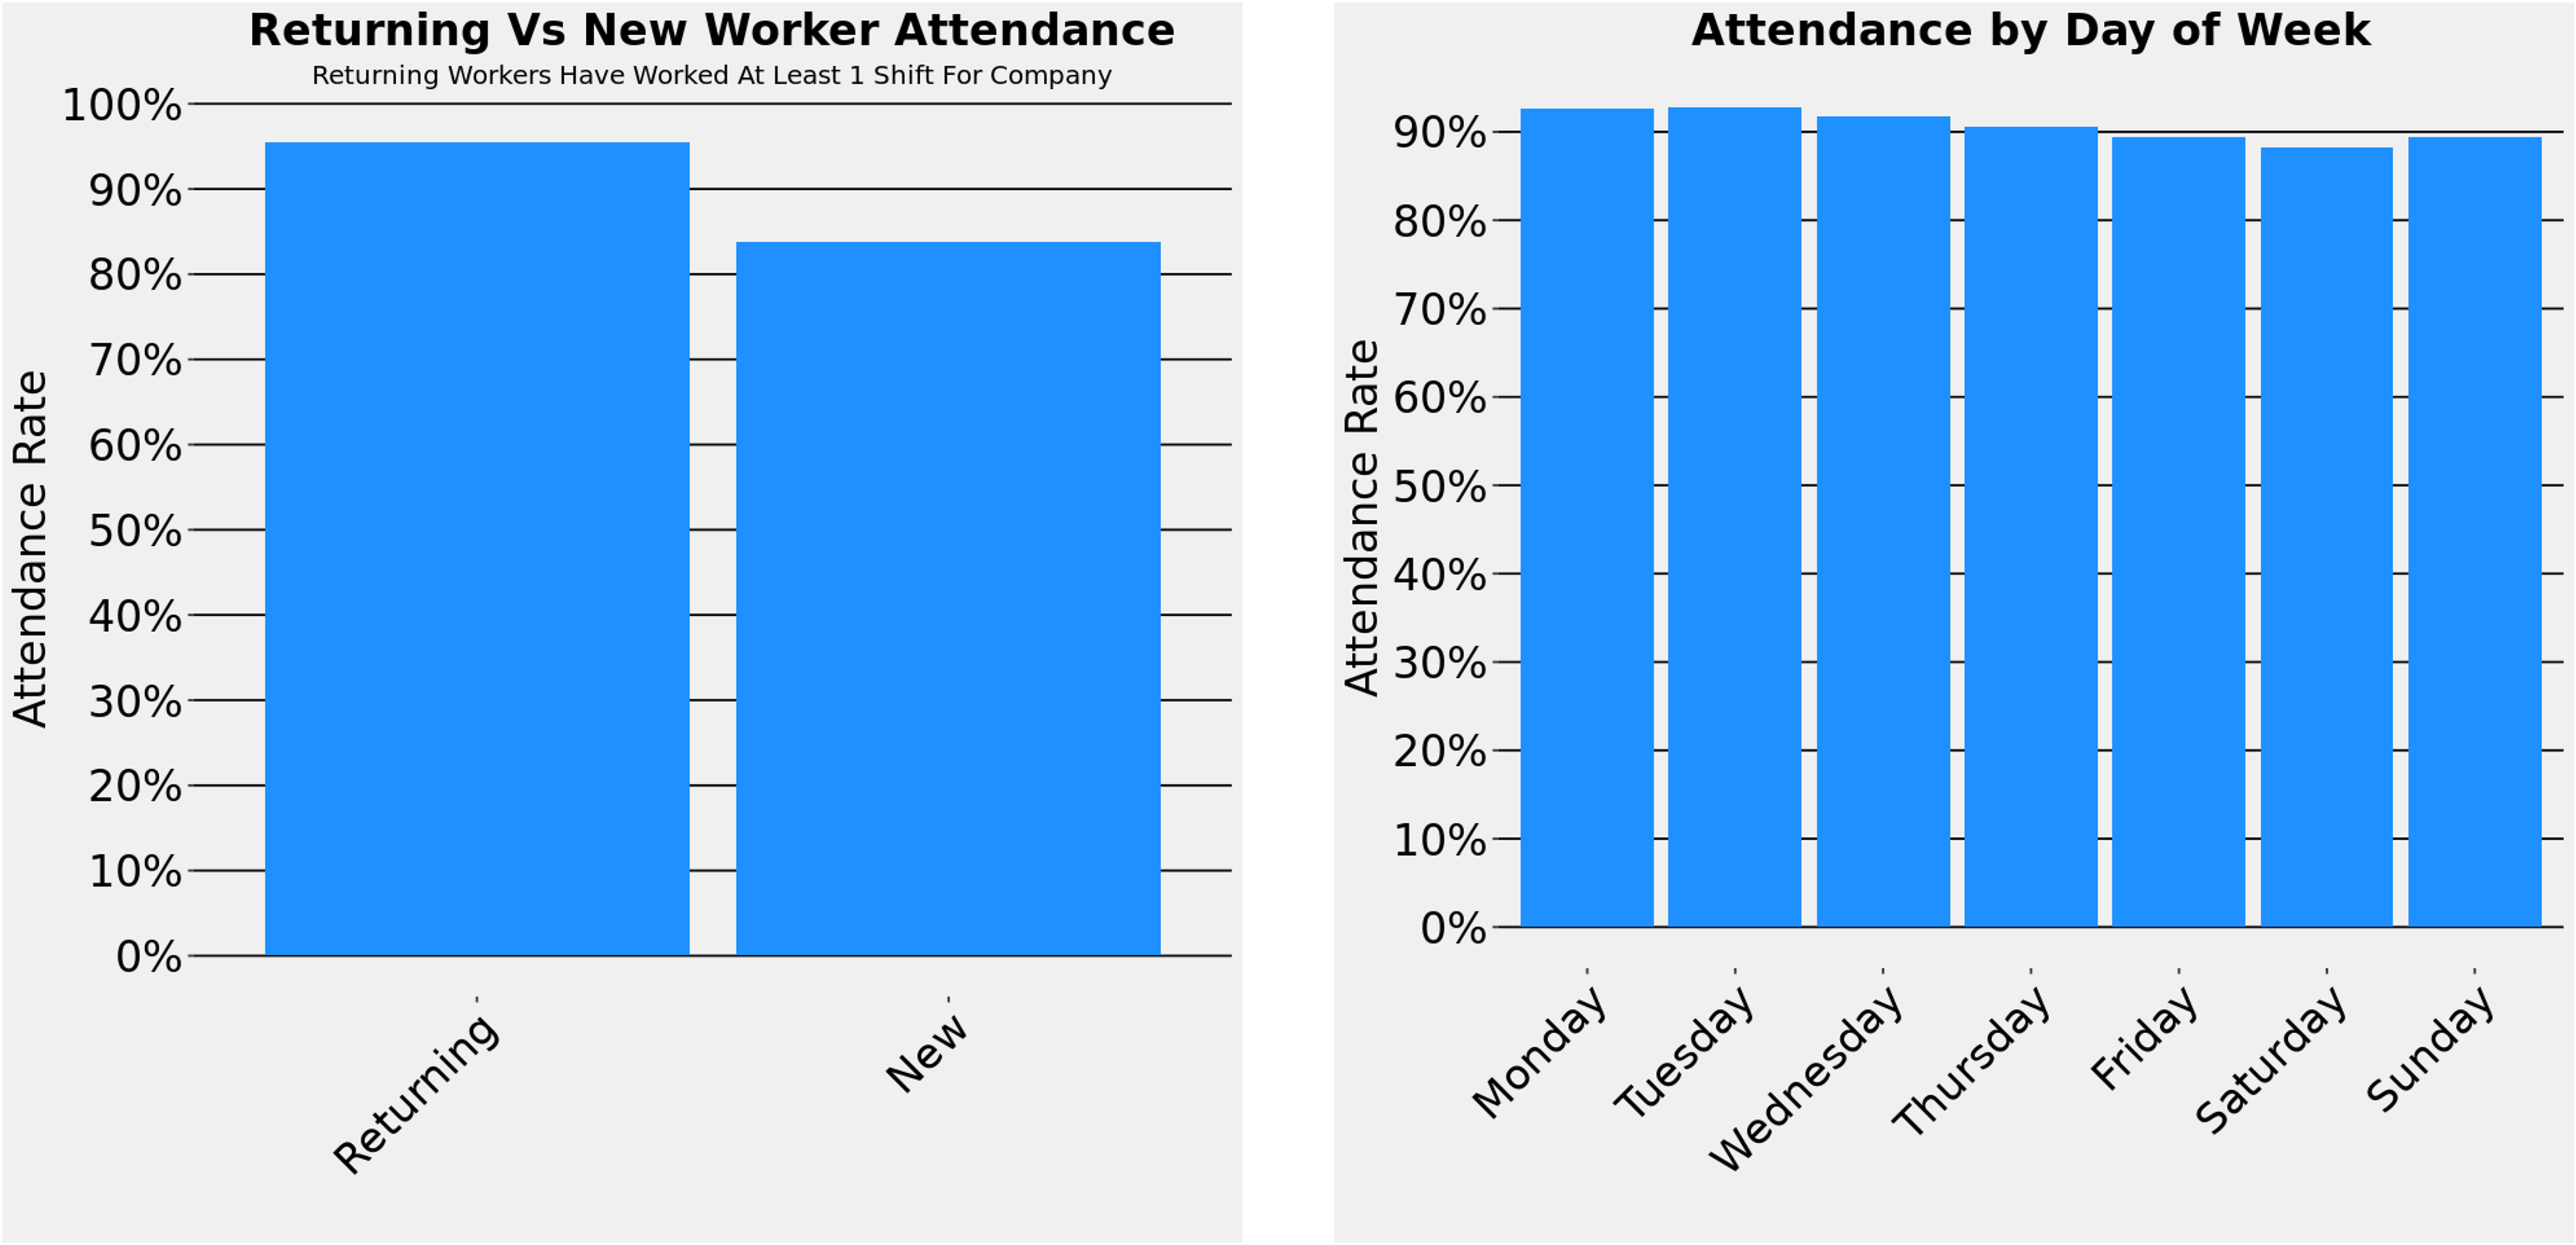
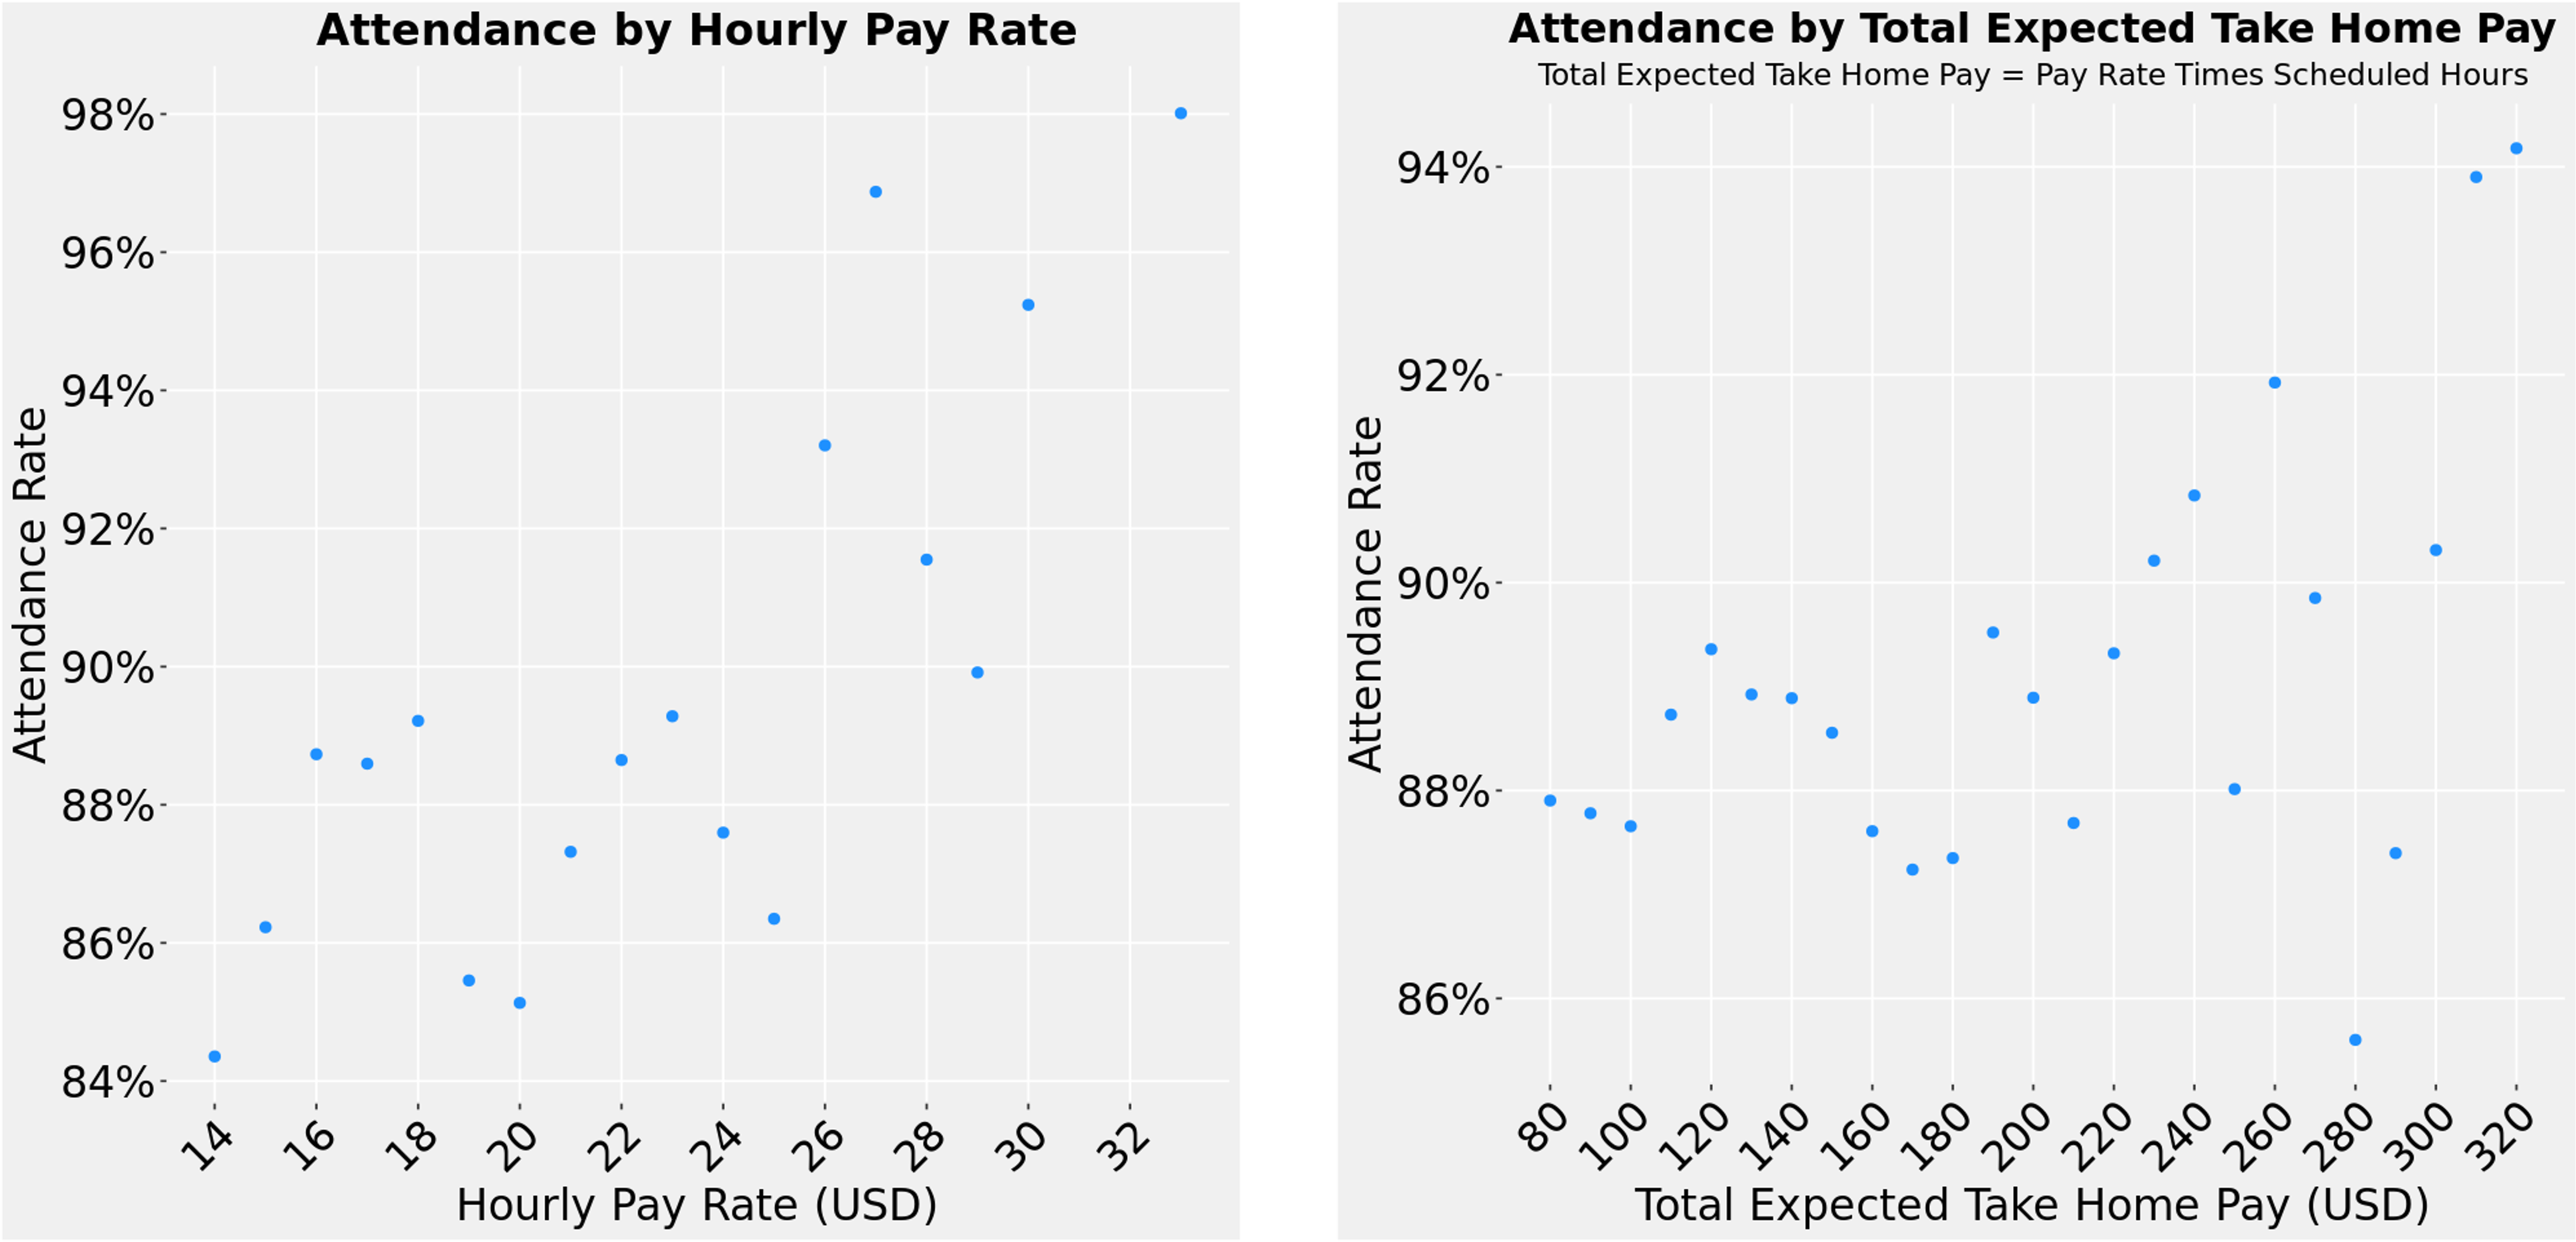
Now that we understand worker retention trends, let’s look at worker attendance. The unpredictable nature around when workers will call in sick, have family obligations, or other reasons for being unable to work a shift, makes scheduling a unique challenge in the hospitality industry. Attendance may also be affected by pay, location, weather, day of the week, worker experience, or other event details. The below charts display how attendance rates break out by some of the aforementioned variables.
Data Driven Decision Making
While there are several other variables we must take into account to quantify the optimal size of a workforce, let’s put together what we have discovered so far to come up with a simplified estimate for our example catering company in New York City.
This company wants to feel assured that they can staff 200 shifts in a single day, and 350 per week. They have a 95% attendance rate, exceeding the industry average, due to competitive pay rates, convenient parking options, and an exciting working atmosphere. Additionally, they have 100 core workers and an 80% worker shift acceptance rate. They are capable of hiring an additional 10 workers per week. Inputting these metrics into our custom model yields 402 workers to meet their demands both near and long term.
As mentioned, determining the right workforce size may require different approaches for different businesses. Regardless of the approach, data can serve to supplement decision making and enhance scheduling outcomes. In many cases, machine learning algorithms can solve these workforce challenges for us. If your business is facing similar challenges, we would love to help!
Click here to see how Nowsta can help you optimize your workforce.