Workforce dynamics are constantly shifting, and access to precise, real-time data is essential for strategic decision-making. The Nowsta platform offers a clear view into the hourly labor market, revealing trends that impact both businesses and workers. In October alone, Nowsta facilitated the payout of $67 million in wages, demonstrating the scale of activity across our integrated workforce management system. This report analyzes key wage and tip data from the past year, offering insights into the evolving compensation landscape.
National Wage Growth Continues its Upward Trend
Our data shows a persistent upward trend in hourly wages across the United States, matching the rate of current inflation. On average, hourly pay rates increased by 3.0% year over year. This growth signals a competitive labor market where employers are adjusting compensation to attract and retain talent. For businesses, this trend underscores the necessity of benchmarking pay rates to remain competitive. For workers, it reflects growing earning potential in the hourly sector.
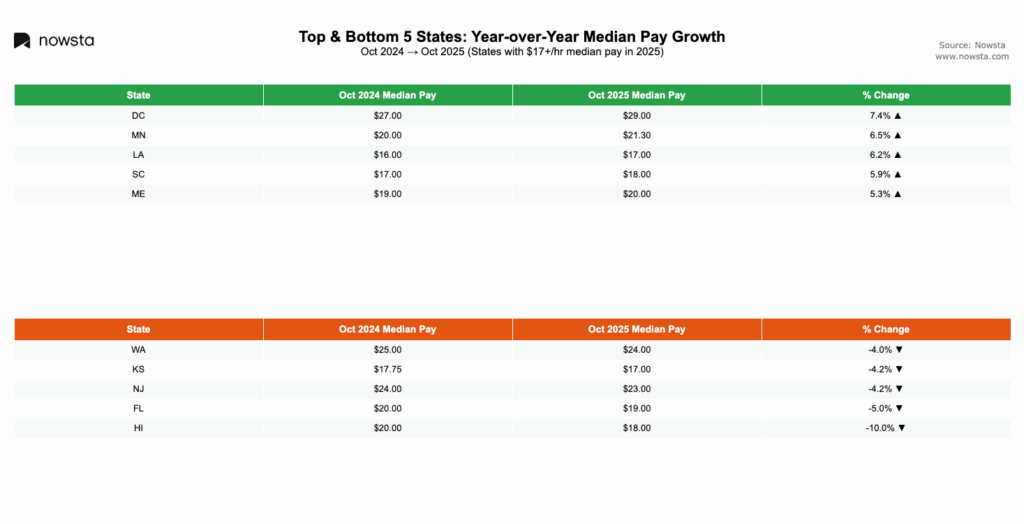
This wage inflation was not uniform, however. A closer look at state-level data reveals significant regional variations.
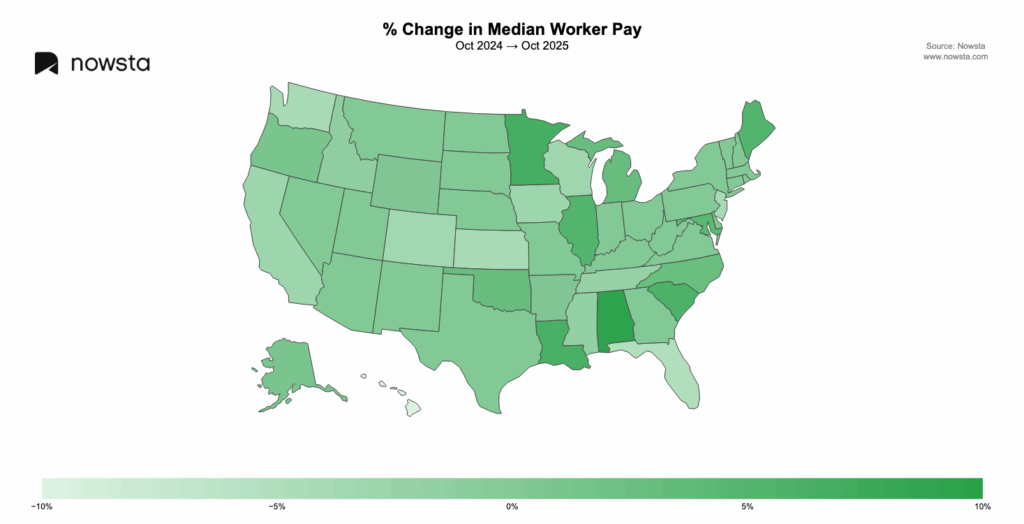
State-by-State Wage Analysis
Positive wage growth was recorded in 37 of the 50 states, indicating a widespread, though not universal, economic trend. Washington D.C. and Minnesota led the nation with the most significant percentage increases in hourly wages. This suggests strong regional demand for labor in these states, forcing employers to offer more attractive compensation packages.
Conversely, Hawaii and Florida experienced the largest percentage drop in hourly wages year over year. These regional downturns could be attributed to various factors, including shifts in local industry demand or changes in the labor supply. Businesses operating in these states may find it easier to manage labor costs, while workers may face more challenging wage environments.
Sector-Specific Wage Fluctuations
Analyzing wages by job role provides a more granular understanding of market dynamics. Certain sectors saw robust growth, while others experienced slight contractions.
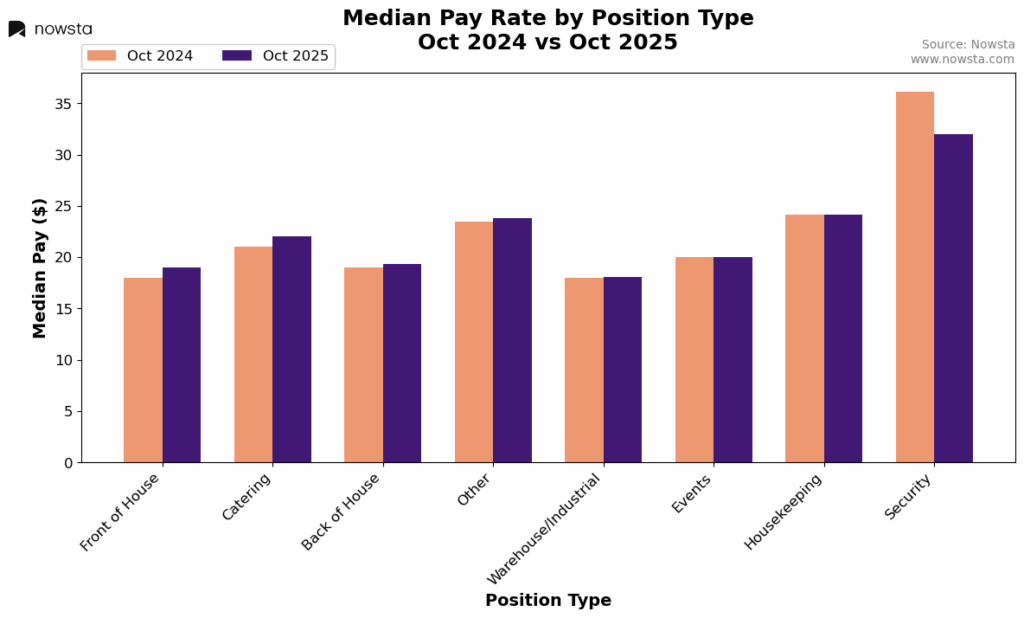
Top Performing Roles
Front of House (FOH), Catering, and Back of House (BOH) positions saw the greatest year-over-year increases in hourly wages. The surge in pay for these roles points to high demand and a potential shortage of specialized labor. As events and hospitality continue their strong recovery, businesses are competing for experienced staff to manage kitchens, maintain facilities, and execute high-quality service.
Another key area to watch is the security sector. While security is a relatively new job category on the Nowsta platform, its inclusion reflects the growing demand for professional security services across various industries. We will continue to monitor wage trends in this emerging category.
Analyzing Tipping Trends
While the base wage for tipped roles saw a minor increase, the tips themselves remained a consistent and significant component of total earnings.
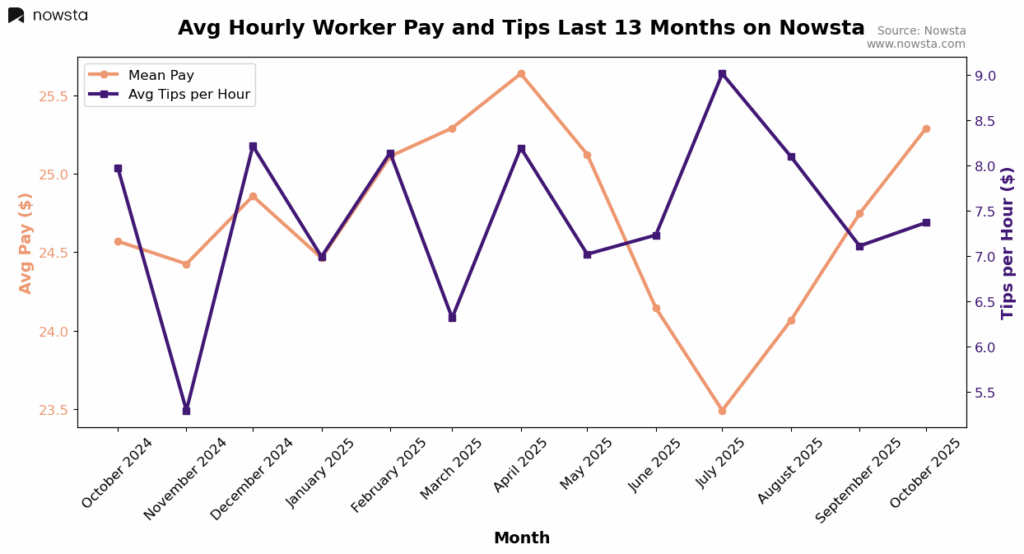
Hourly Tips Hold Steady
Average hourly tips have remained remarkably stable year over year. Data from last October to this October shows an average of approximately $7.50 per hour worked. This consistency provides a reliable baseline for both workers forecasting their income and employers structuring their compensation models.
Although the annual average is stable, tips do fluctuate monthly. Our data shows a typical range between $7 and $9 per hour. This past October, for instance, the average came in at $7.48 per hour. These fluctuations are often tied to seasonality, event volume, and consumer spending patterns.
The Future of Tip Taxation
A significant legislative development could soon impact these trends. A proposed bill aims to eliminate federal taxes on tips, which would directly increase the take-home pay for millions of tipped workers. If passed, this policy could have profound implications. It may make tipped positions more attractive, potentially easing labor shortages in the hospitality sector. For employers, it could alter compensation strategies and even influence base wage calculations.
Navigating the Data
The October labor market data paints a picture of targeted growth and evolving compensation structures. While national wages are rising, the increases are concentrated in specific states and job roles. For tip-based workers, earnings remain strong and consistent, with potential legislative changes on the horizon.
Understanding these dynamics is the first step toward optimizing your workforce strategy. By leveraging data-driven insights, businesses can make informed decisions on everything from scheduling and payroll to recruitment and retention, ensuring they remain competitive in a complex labor market. Nowsta provides the tools to not only manage your workforce but to understand the trends that define it.
Request your custom demo today, and learn how this kind of data can help drive your organization to the next level.